Deep Dive: ASML Holding (ASML)

This is the final deep dive in the semi-cap equipment names I own in the fund. I will paste links below to the prior two:
Deep Dive: KLA Corporation KLAC 0.00%↑
Deep Dive: Applied Materials AMAT 0.00%↑
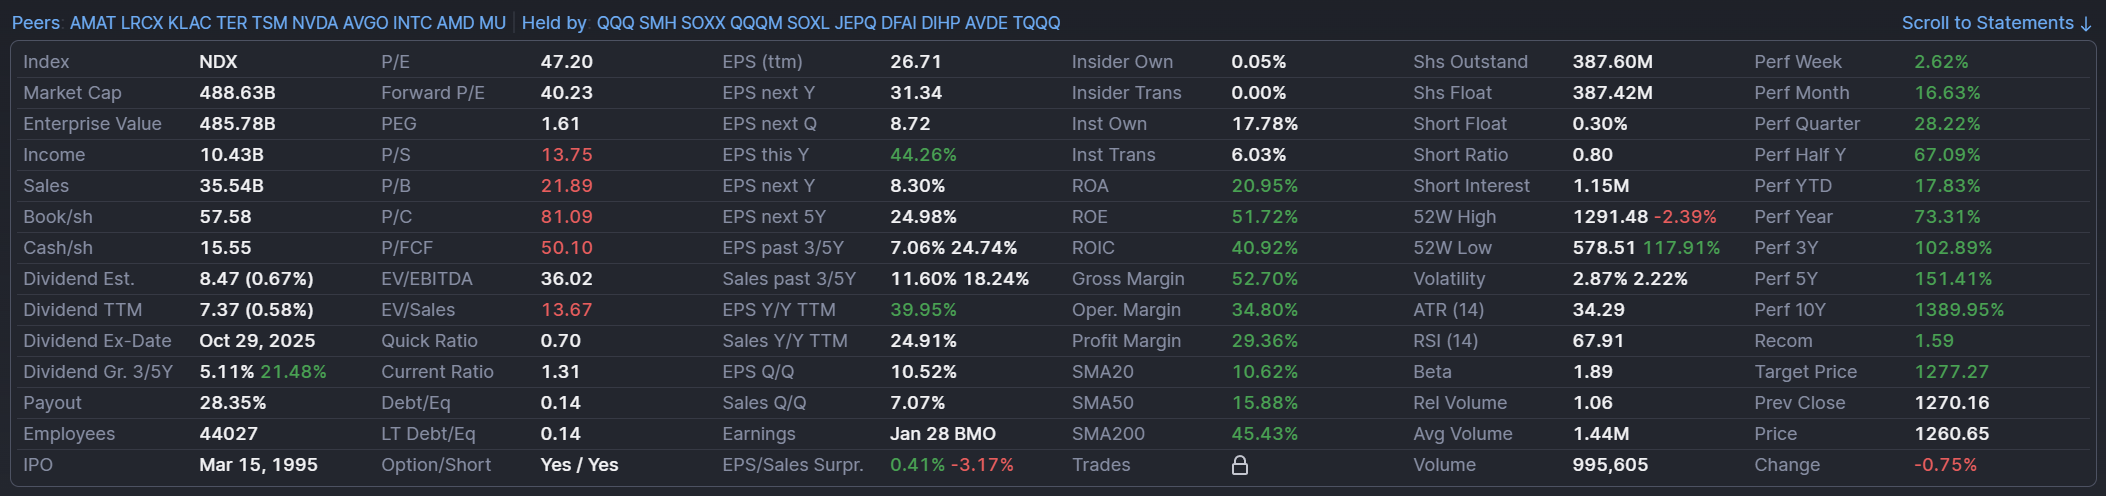
Alright back to ASML. ASML Holding sits at the heart of the semiconductor capital equipment industry, supplying the advanced lithography machines required to print cutting-edge chips. The stock has surged in the past year (up ~74% year-on-year as of Jan 14, 2026[1]) amid excitement over AI-driven chip demand. This raises a crucial debate: is ASML a “complexity toll booth” – a structural compounder that can tax the rising complexity of chips (through more EUV layers, High-NA EUV rollout, a growing service annuity, and pricing power) – or is it still a high-quality cyclical whose valuation already prices the next upturn, with risks from export controls, customer timing, and execution on new technology?
In the semiconductor world, all roads lead through ASML. The company’s EUV lithography tools are essentially a mandatory “tax” on any chipmaker pushing the envelope of Moore’s Law. As AI and 5G drive demand for ever more complex chips, ASML’s machines are in greater need – but with the stock near all-time highs, investors must decide if ASML can keep extracting scarcity value or if a cyclical reality will reassert itself. Is ASML truly a secular toll collector on complexity, or just the best house in a boom-and-bust neighborhood?

What They Do
ASML generates revenue from two main streams:
(1) New lithography systems – selling extreme ultraviolet (EUV) and deep ultraviolet (DUV) scanner machines to chip manufacturers
(2) Installed Base Management (IBM) – providing services, spare parts, upgrades, and software to the existing installed base of ASML tools[2][3].
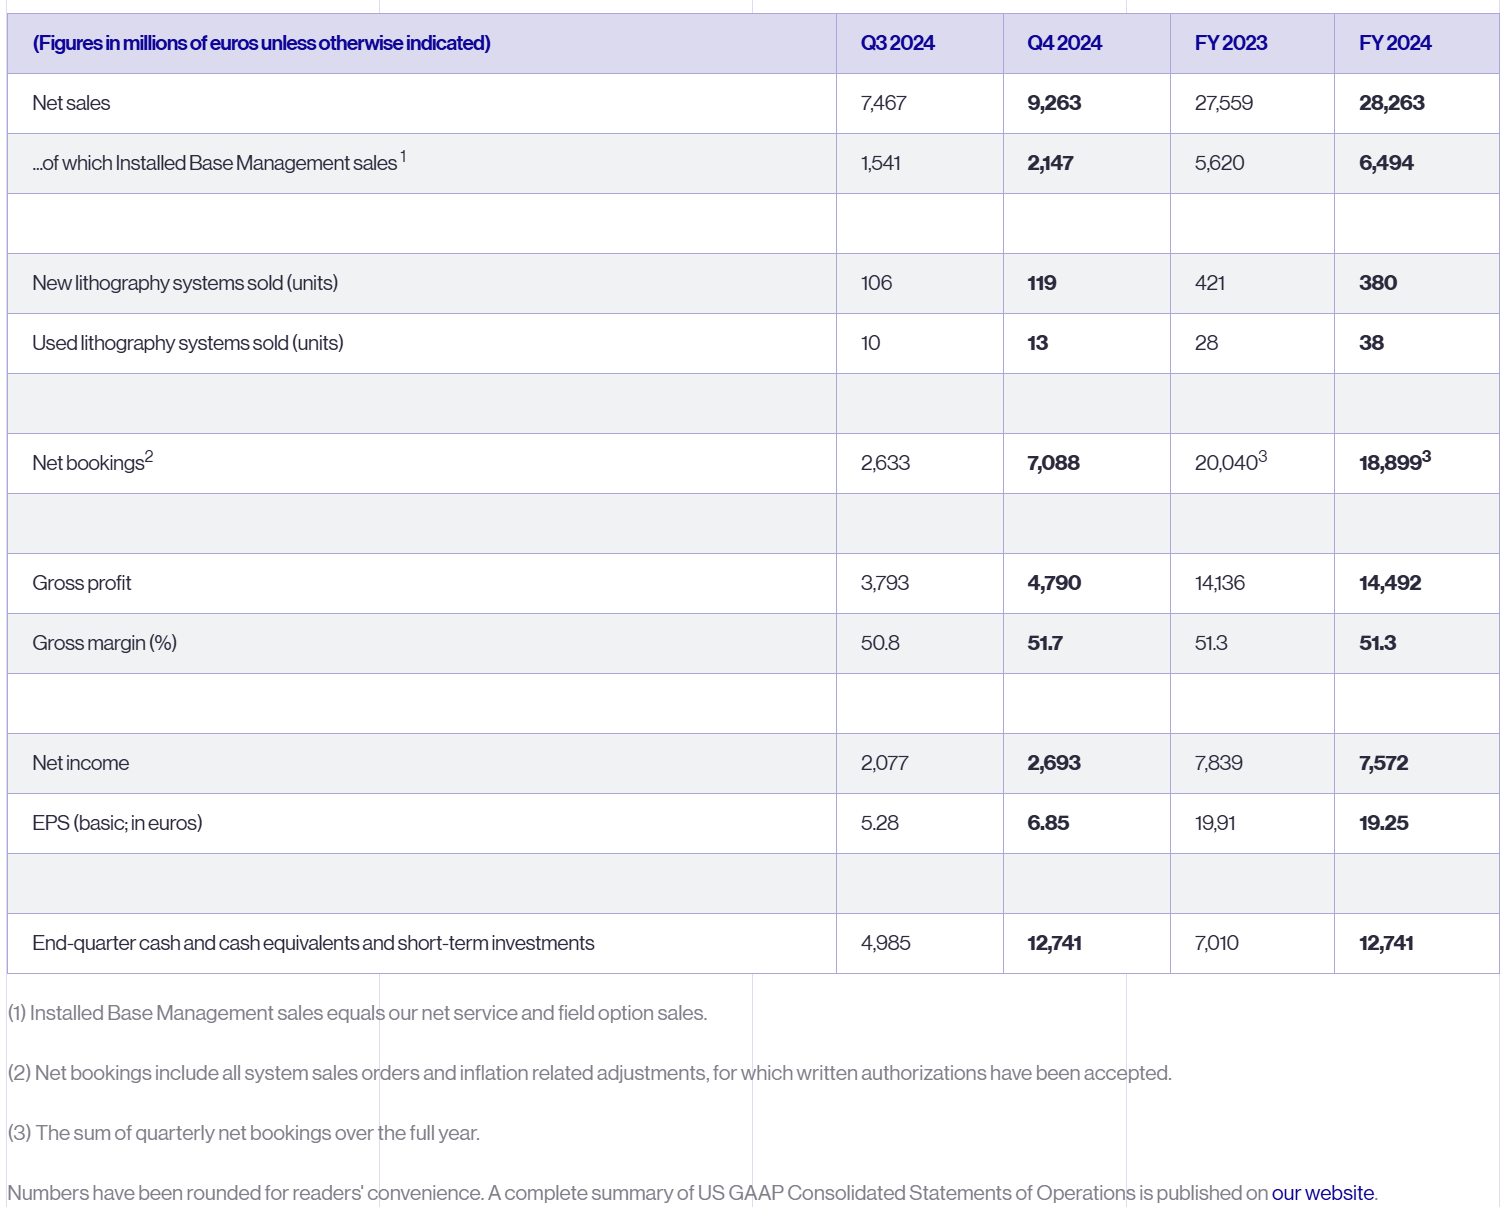
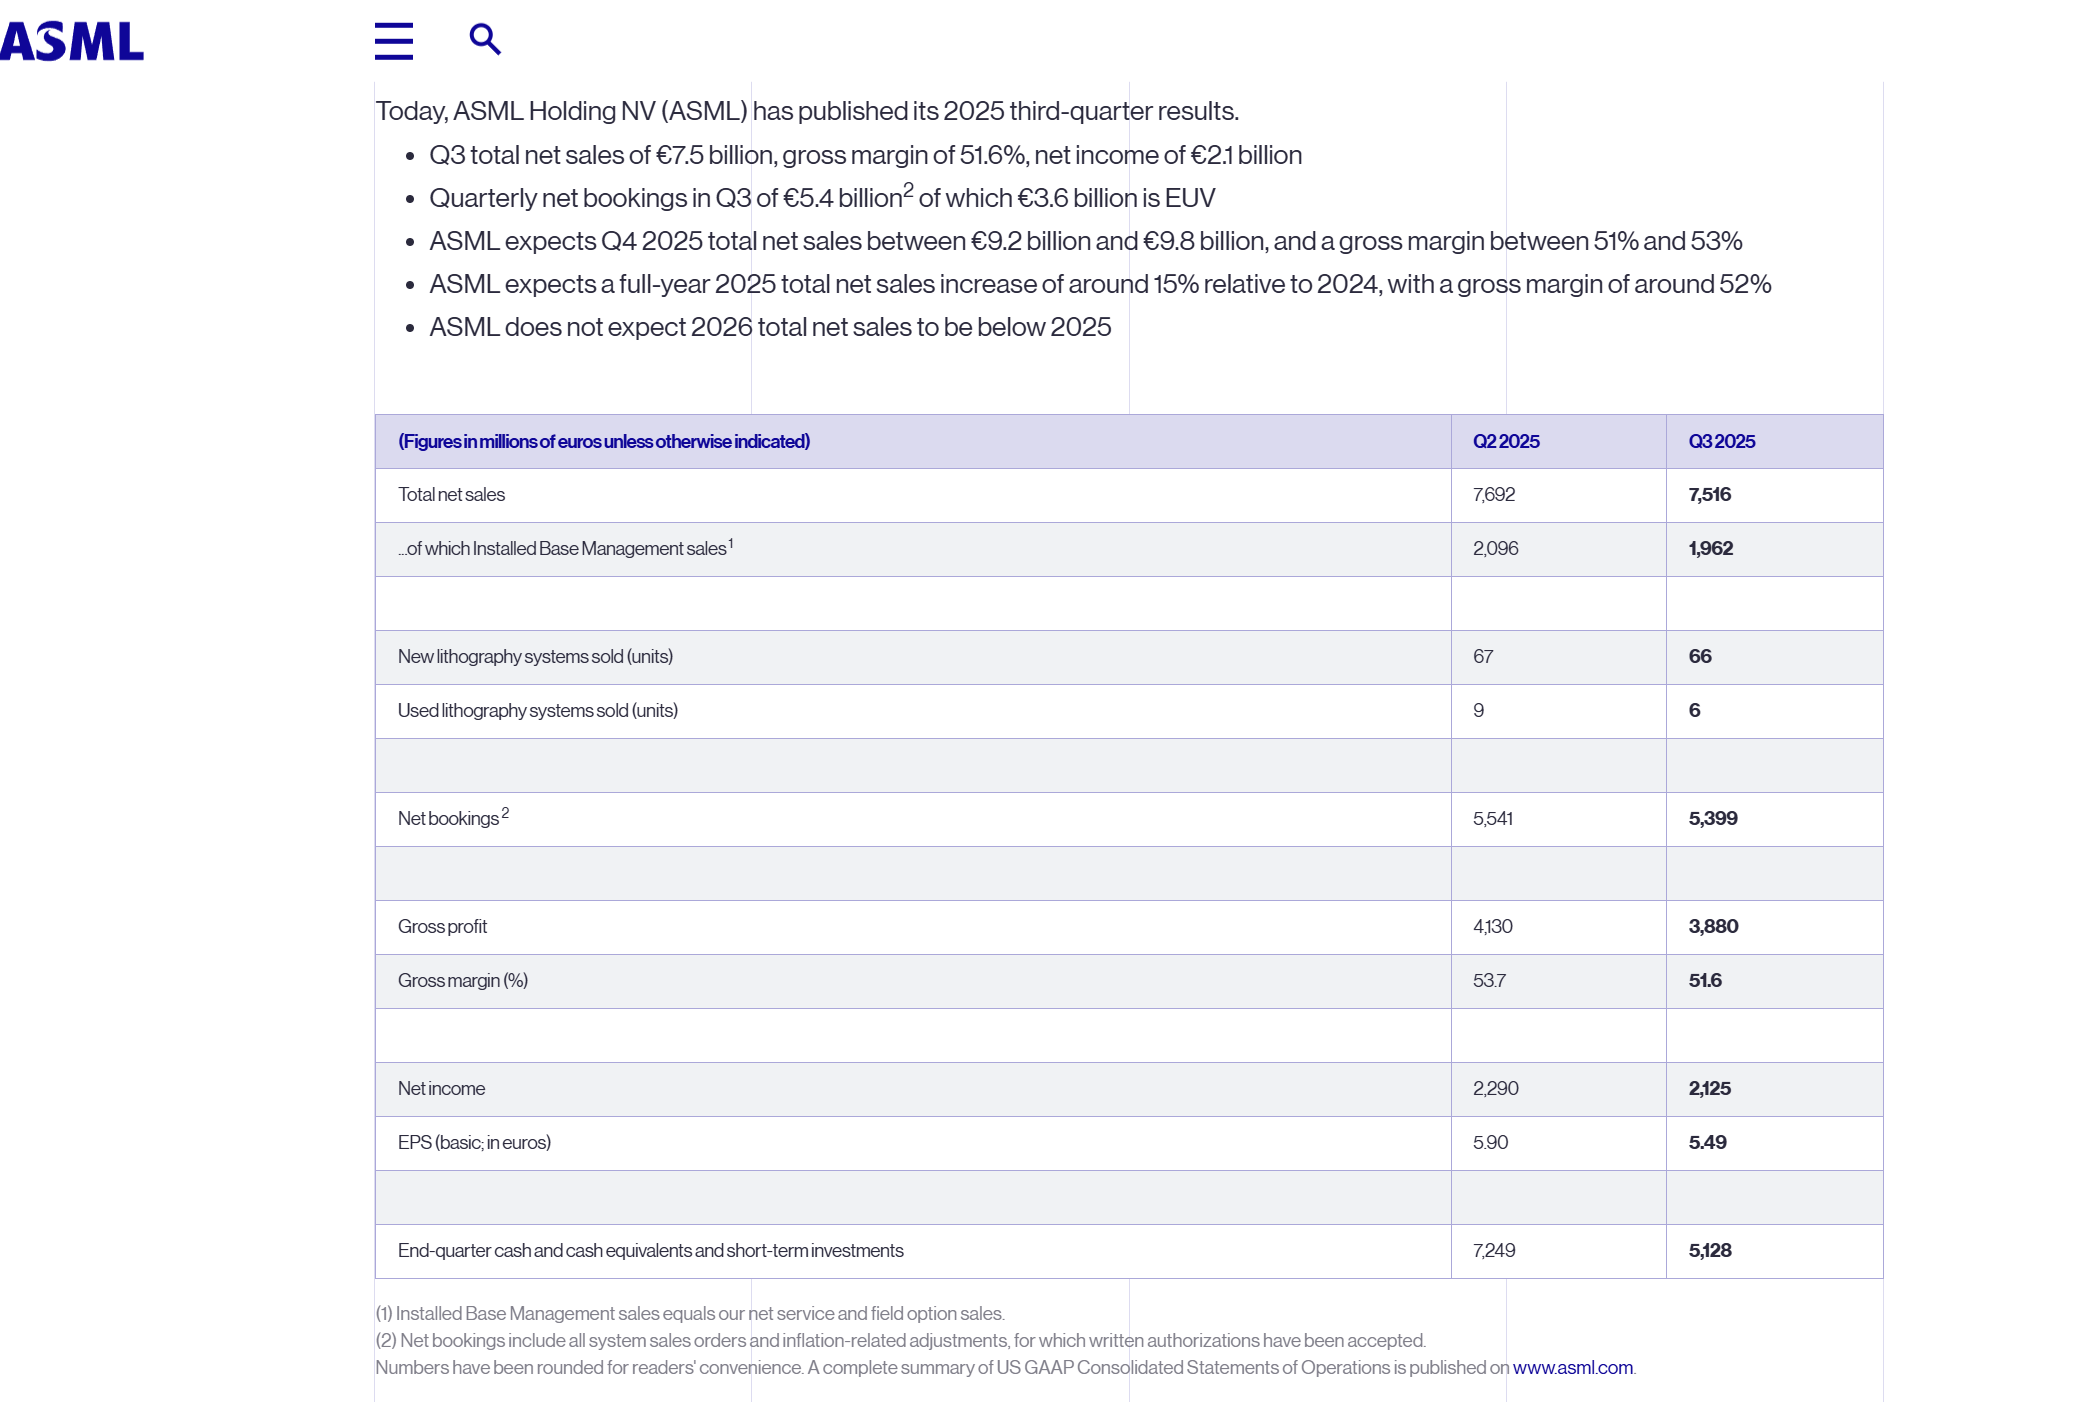
In 2024, ASML sold 380 new lithography systems (plus 38 used/refurbished units)[4], and about 23% of its €28.3 billion 2024 net sales came from Installed Base Management (≈€6.5 billion in service/upgrade revenue)[5]. The product mix includes EUV scanners (for leading-edge <7nm logic and upcoming <10nm DRAM nodes) and DUV scanners (immersion and dry scanners used for more mature layers/nodes). ASML currently holds a virtual monopoly in EUV lithography – no other company can supply production-capable EUV tools[6] – and ~90% share in advanced DUV immersion lithography (Nikon is the distant #2)[7].
EUV vs DUV Mix: EUV tools are fewer in number but very high in value (each EUV scanner sells for on the order of $150+ million, rising to ~$430 million for next-gen High-NA tools[8]). DUV tools (ArF immersion and KrF/i-line scanners) sell for less per unit but still make up a large portion of unit volume. ASML’s gross margins are healthy across both categories, but EUV initially carried slightly lower margins due to its complexity. As EUV has scaled, margins have improved (ASML’s overall gross margin was ~51.3% in 2024[9], and management guides ~52% for 2025[10]). Notably, services and field options (IBM) are a lucrative, high-margin business – critical for smoothing cycles. In Q4 2024, ASML even cited “additional upgrades” sold to customers as a driver of record quarterly revenue[11], underlining how the installed-base business can buoy results when new tool demand moderates.

Where the Margins Come From: ASML’s profitability stems from its technological moat and pricing power. Gross margin on cutting-edge tools and services tops 50%[9], and operating margin is in the mid-30s (trailing ~34.8%[12]). The company’s net profit margin is ~29%[12]. These elite margins reflect minimal competition (especially in EUV) and the mission-critical nature of ASML’s products – chipmakers are willing to pay premium prices because without ASML’s scanners, advanced chips literally cannot be made. Services (maintenance contracts, productivity upgrades, software enhancements) contribute steady income at high incremental margin, since keeping multi-million-dollar tools running at >90% uptime is essential for fabs. In 2024, service/upgrade sales grew to €6.49 billion[5] (from €5.62 billion in 2023), showcasing the durable “annuity” from the installed base even in a year when new system bookings were cooling off.
The Thesis
ASML’s bullish identity is that of a unique choke point in the semiconductor value chain – effectively a toll booth that collects a fee on every advance in chip complexity. The more complex and densely packed chips become, the more lithography steps (and particularly EUV layers) are needed, and the more ASML benefits.

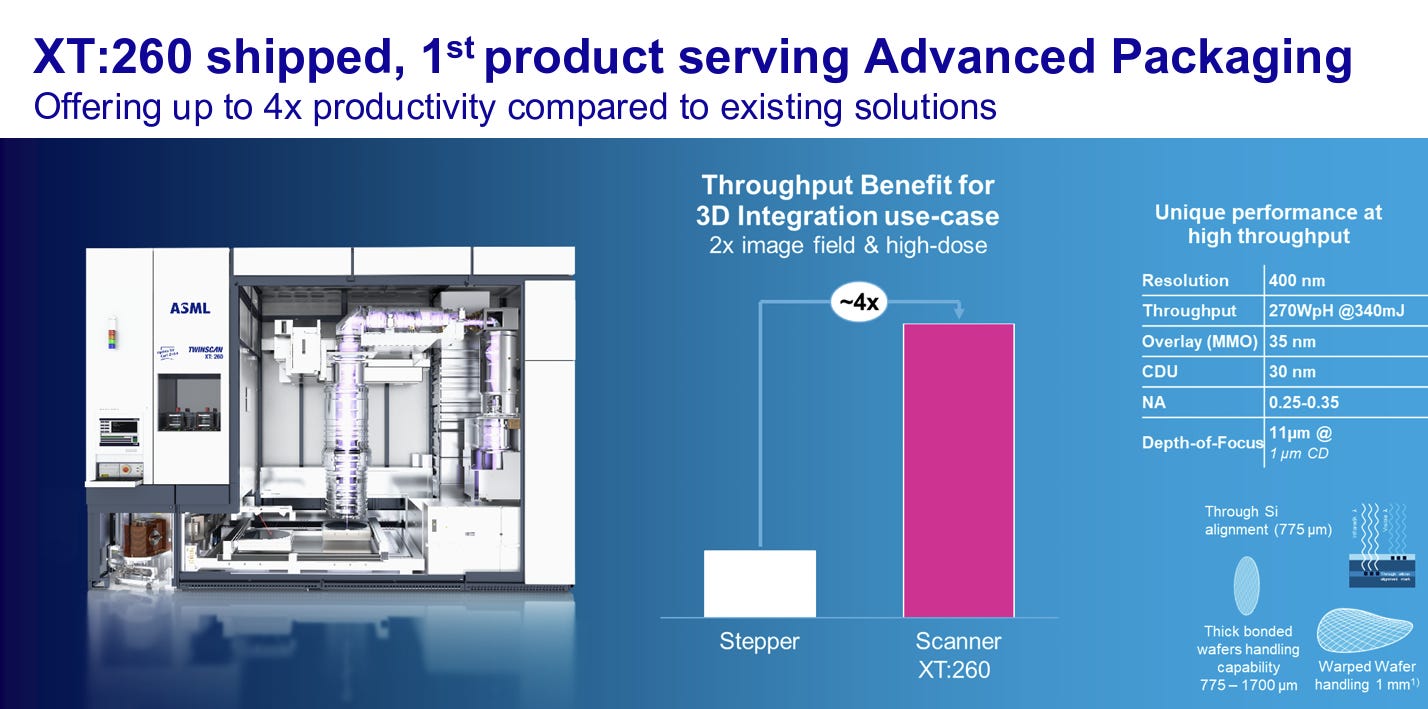
This gives ASML scarcity value: chipmakers have no alternative but to buy its tools, often at increasing prices. Management and customers alike note that “lithography intensity” (number of critical exposures per wafer) is rising[13]. For example, cutting-edge logic at 3nm may use ~20 EUV layers (versus ~5 layers at 7nm a few years ago), and DRAM makers are starting to adopt multiple EUV layers for 1α/1β nodes[14]. This means even without wafer volume growth, demand for lithography capacity (measured in total exposure steps) grows – effectively a complexity tax that ASML can levy. ASML’s EUV order book has remained strong through cycles (the company expects ~+30% growth in EUV business in 2025[15][16]) because customers are pushing more layers onto EUV for yield and density gains. Furthermore, ASML’s near-monopoly allows it to raise prices periodically (the first High-NA EUV systems reportedly cost ~$400M+ each[8], significantly higher than prior-gen EUV) and to pass on inflation via contract adjustments[3] – evidence of pricing power that is rare in capital equipment. The bull thesis holds that ASML’s installed base and service revenues will only expand as more scanners are deployed (ensuring a stable cash-generative core even in down years), and that new growth avenues like High-NA EUV, advanced packaging lithography (e.g. the new XT:2600 i-line tool for chiplets[17]), and computational lithography software will add incremental “toll booths.” In short, as long as the semiconductor roadmap stays alive, ASML can keep extracting rent, making it a structural compounder rather than a cyclical play.
The more cautious take is that ASML, for all its strengths, still ultimately rides the wafer fabrication equipment (WFE) spending cycle. In this view, the “complexity tax” frame is partly overstated – during industry downturns, even ASML sees order push-outs and slower growth, and the stock can de-rate. Indeed, ASML’s net bookings fluctuated significantly recently: e.g. in Q3 2024, orders plunged to €2.6 billion (vs >€6 billion a quarter earlier) as memory customers and China paused spending[18]. While ASML’s backlog cushioned revenue (backlog was a massive €38 billion entering 2024[19][20]), a prolonged capex downcycle will catch up to shipments eventually. Bears note that ASML’s China-driven boost in 2023–2024 is set to reverse: China comprised ~26% of ASML’s revenue in 2023[21] and an even larger ~36% in 2024[22] (as Chinese firms rushed to buy DUV tools ahead of export curbs), but ASML expects its China sales to drop to a “more normalized” ~20% of revenue in 2025[23] due to new Dutch/U.S. export restrictions. That effectively creates a ~€2–3 billion/year headwind that other regions must offset. Additionally, some argue that ASML’s dominance invites customer pushback – major customers like TSMC or Samsung might seek ways to reduce reliance (e.g. optimizing designs to use fewer EUV layers or exploring multi-pattern DUV alternatives) if ASML’s lead times and costs become too painful. High-NA EUV’s success is not guaranteed either: it faces technical gating factors (resist chemistry, mask defects, huge power/footprint requirements) and most customers (except Intel) are not rushing in before 2027–2028[24]. Finally, valuation is a concern – at ~40× forward earnings[25][26], the stock already discounts a robust upcycle ahead. If 2026–2027 end up flat or if execution falters (e.g. delays in High-NA throughput, a major customer like Intel delaying its next node, or geopolitical shocks), ASML could be treated more like a cyclical equipment name again (with a lower multiple). In summary, skeptics see ASML as the best-in-class within a cyclical sector – but not entirely immune to that cyclicality, especially now that expectations (and its valuation) are sky-high.
Financials
All figures are latest available, on a trailing twelve-month (LTM) basis as of Q3 2025 or the most recent reported period:
Revenue (Net Sales): €32.2 billion (LTM Q4’24–Q3’25). Growth: +24.9% YoY (ttm)[40]. (ASML reported €28.3 billion for full-year 2024[41][4] and expects ~+15% in 2025 to ~€32.5 billion[10].)
Gross Profit Margin: ~52.8% (LTM). (Was 51.3% in 2024[9]; guided ~52% for 2025[10]. Current ttm gross margin ~52.7%[12].)
Operating Margin: ~35% (LTM). (Operating income ~€11 billion on ttm sales, by estimate – 2024 op margin was 31.8%[37]; ttm operating margin is higher at ~34.8%[12] due to improved 2025 quarterly margins.)
Net Income: ~€9.5 billion (LTM). Net margin: ~29%. (2024 net income was €7.6 billion[41][42]; trailing twelve-month net profit margin is ~29.4%[12].)
EPS (Basic EPS): ~€24.30 LTM (≈ $26.70/share). (2024 EPS was €19.25[37]; trailing EPS in USD is $26.71[1] which implies ~€24+).**
Free Cash Flow: ~€8–9 billion LTM. FCF yield: ~1.9%. (OCF was €11.2B and capex ~€2.6B in 2024[43], yielding ~€8.6B FCF. At a ~$490B market cap, that’s ~1.8% FCF yield.)
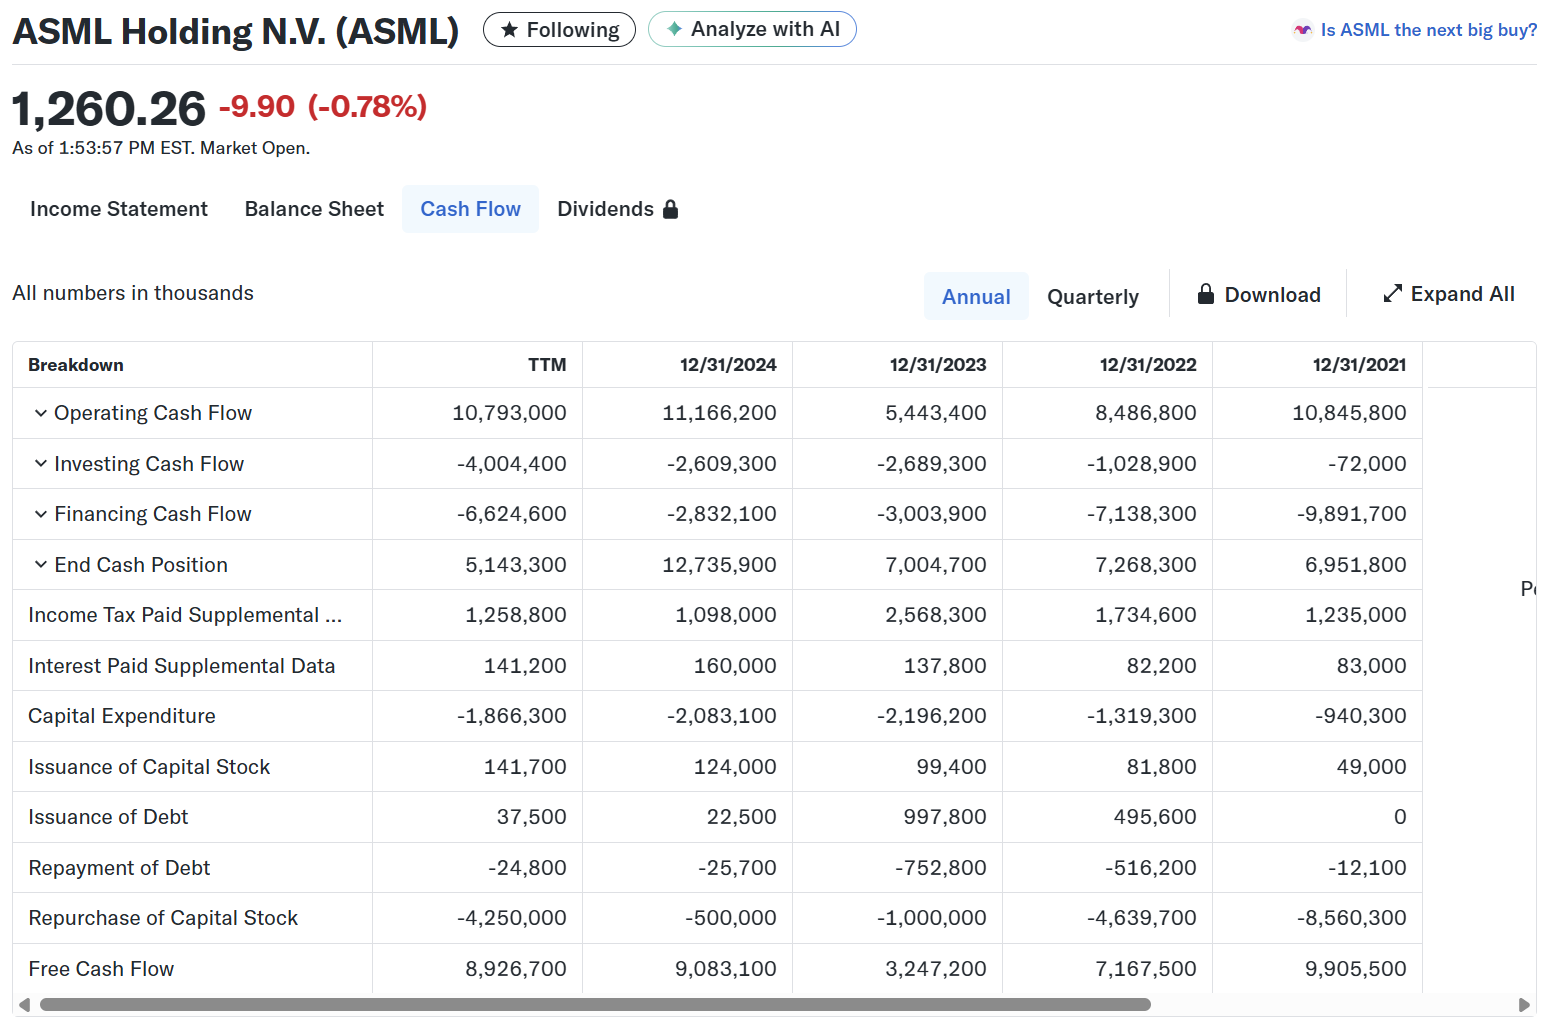
Net Cash / (Debt): ~€3 billion net cash. (€5.1B cash & short-term investments on hand as of Q3 2025[44] against ~€2 B of debt; debt/equity is only 0.14[45].)
Dividends: ~€7.4 per share (ttm) which is a 0.58% yield[12]. (Interim dividend €1.60 paid Nov 2025[46]; total 2025 dividends expected around €5.80/share.)
Share Buybacks: €5.9 billion repurchases from 2022 through Q3 2025 (9.0M shares)[47]. (ASML signaled it will not complete the full €12B program by 2025, but will announce a new buyback in Jan 2026[48].)
Backlog: ~€33 billion as of Q3 2025. (Roughly one year of revenue coverage. Backlog peaked around €39B in late 2023[19][20] and has eased with fulfilling of China orders. Still, €33B backlog in Q3 2025 highlights robust demand pipeline[49].)
Market Cap (Current): ~$490 billion (Jan 14, 2026)[25]; Enterprise Value: ~$487 billion[25].
Valuation Multiples: Forward P/E ~40×; TTM P/E ~47×[50]. EV/EBITDA ~36×[12]. P/B ~22×; P/FCF ~50×[1]. These multiples are well above semi-cap peers (see Valuation section).
(Sources: Company reports and financial data[4][9][52]. All data current as of Jan 14, 2026.)
Product Mental Model
Think of ASML’s lithography machines as the bottleneck enabling tool in chip fabrication. Every transistor layer on a chip must be patterned by a lithography scanner – no matter how fancy the design, it can’t be realized without these optics and lasers printing it. In modern chip fabs, lithography is often the rate-limiting step: if an ASML scanner goes down, that whole production line stalls.

Each ASML machine is an enormously complex unit (an EUV scanner weighs ~150 tons – akin to two Airbus jets[53] – and contains precision components like Zeiss mirrors aligned to picometer tolerances). These tools operate at extreme performance: e.g. ASML’s latest NXE:3800E EUV scanners achieve ~160 wafers per hour throughput, and the new EXE:5200 High-NA EUV is expected to hit 170–175 wafers/hour[27], a ~60% productivity jump[27].

Higher throughput directly improves customers’ economics (more wafers output per day per $200M+ tool). Thus, ASML’s R&D focus (and one avenue for monetization) is providing productivity upgrades – for instance, faster stages, improved source power, and software tuning – which it often sells as options or field upgrades to boost existing tools’ performance. Many customers eagerly pay for these, since even a 5% uptime or throughput gain can save millions in fab costs.
Lithography Intensity & EUV Layers: A key reason ASML can be seen as a “complexity toll booth” is that chips are using more lithography steps than ever. In older nodes, a chip might require ~30 lithography exposures; at 3nm, it can easily exceed 50 exposures, with ~20 of those on EUV. Likewise, advanced DRAM that once used 0 EUV layers at 1X nm may use 4–6 EUV layers at the sub-10nm generation[14]. This increase in layer count means chipmakers need more scanner capacity even if wafer starts remain flat – essentially more shots = more machines (or more hours). ASML benefits in two ways:
(1) Unit demand – a fab might need to purchase additional scanners to handle the extra layer steps and maintain throughput.
(2) Utilization and service – if customers run their scanners harder (more shifts, higher duty cycle), ASML’s service business sees higher parts replacement, maintenance, and upgrade demand (e.g. more laser modules, more collector mirrors over time).
ASML CEO (now President) noted “litho intensity continue[s] to develop positively as EUV adoption gains momentum”[13] – meaning each wafer is incurring more litho work. This dynamic underpins ASML’s growth beyond just selling X machines per fab: even a fixed installed base generates more value as layer complexity rises. In effect, ASML’s “content per wafer” is increasing.
Throughput Economics: To appreciate ASML’s value-add, consider that an EUV machine costs on the order of $150–200 million and can process ~125–175 wafers/hour (depending on model)[27]. That translates to roughly 1,000–1,400 wafers per 8-hour shift, or ~10,000 wafers/week per tool. If each wafer has, say, 10 EUV layers, that’s 100k layer exposures per week. The cost per exposure is high – but still cheaper than not scaling to advanced nodes. From a fab’s perspective, the throughput and uptime of these scanners is critical: downtime is ruinous. This is why ASML’s service engineers are essentially embedded at customer sites and why ASML can charge premium rates for service contracts and spare parts (customers willingly pay to ensure maximal uptime ~>90%).
Bottleneck Machine: In semiconductor manufacturing, multiple process steps (deposition, etch, inspection) are needed, but lithography is often the longest queue. In leading-edge logic fabs, there might be 30 EUV scanners supporting dozens of other tools – everything else waits if litho can’t keep pace. Therefore, adding an extra litho tool (or upgrading one to run faster) directly boosts fab output. ASML’s dominance here gives it leverage: for instance, if ASML introduces a software that can optimize scanner scheduling or improve overlay by a few percent, that can improve yield and line throughput – a big win for the fab, and a new software license sale for ASML (ASML’s Brion computational lithography and YieldStar metrology systems play in this area).
In simple terms, ASML’s machines are the gatekeepers of Moore’s Law. Every time chips get more complex or smaller, it “taxes” the lithography stage more – requiring either more exposure passes (which means more machines or more hours) or more advanced lithography tech (like High-NA EUV). Either way, ASML is positioned to collect the revenue from that increased complexity, which is why it’s often called the “toll booth” of the semiconductor industry. One cannot make advanced chips without paying ASML – and that is the core of its economic power.
Business Model
Order Intake, Backlog & Lead Times: ASML’s business model relies on long lead times and a sizable order backlog. Customers typically place orders many months or even years in advance, especially for EUV tools. As of Q3 2025, ASML’s backlog stood around €33 billion[49] – roughly a full year’s worth of revenue coverage. This backlog provides good visibility, but it’s not a static queue – orders can be reprioritized and, in rare cases, modified or delayed. Notably, ASML’s reported net bookings include not just new orders but also inflation adjustments to existing orders[3]. (For example, if ASML renegotiates tool prices upward due to higher component costs, that increment gets added to bookings.)
This means a spike in bookings isn’t always pure new demand – one must interpret order intake carefully. In late 2022 and 2023, ASML saw extremely strong bookings as customers scrambled for capacity, leading to the record backlog. By Q3 2024, bookings dropped sharply (only €2.6B that quarter)[18] as some customers paused – a reminder that order intake can swing with sentiment and timing. However, ASML emphasizes that outright order cancellations are rare; more common is push-outs (delaying delivery). The backlog can act as a buffer: during a soft patch, ASML continues shipping from backlog even if new orders lag. But if backlog starts materially shrinking without new orders (a key warning sign), it means a downturn is playing out.
ASML’s lead times vary by product. DUV scanners are relatively more standardized and can have lead times on the order of 6–12 months (shorter for older models). EUV scanners, being highly complex, have longer lead times – historically 12–18+ months. In fact, at the peak of demand, ASML began a “fast shipment” process: sending EUV tools to customers before full testing at ASML, then completing installation and acceptance on-site, to shave weeks off the cycle. This transfers some risk (and revenue recognition) to the customer site. ASML’s revenue is recognized upon customer acceptance of the tool, so if an EUV is fast-shipped in late Q4 but only accepted in Q1, the revenue slips to the next quarter – another nuance in modeling quarterly sales. Lead times have prompted ASML to start building inventory ahead of demand: in 2024 they for the first time pre-built some systems to be ready for a forecasted 2025 upsurge[20]. This is unusual (normally they build to confirmed orders) and underscores confidence in demand, but it carries inventory risk if the upsurge doesn’t materialize.
System Shipment Mix & Acceptance: In each quarter, ASML ships a certain number of new systems (e.g. 66 new tools in Q3 2025[54]). This includes a mix of models – from leading-edge EUV to older “refurbished” systems resold. The sales mix directly affects margins: EUV tools have higher revenue per unit but also initially had lower gross margins (due to high costs and low volume); however, with learning curve and volume, current EUV margins approach corporate average, and some DUV tools (especially older models or those sold into cost-sensitive markets like China) can have slightly lower margins if discounted. Another driver is customer support attach rate: nearly every tool sale comes with a service agreement (preventive maintenance, etc.) and often a “field option” package – for instance, a productivity or imaging upgrade installed after delivery, counted under Installed Base Management. In Q3 2025, ASML’s Installed Base Management sales were €1.96B, about 26% of total quarterly revenue[2], showing that roughly €0.26 of every €1 in sales comes from service/upgrades (which have no “units” but track the growing installed base). Over time, as the installed base of ASML tools keeps expanding (ASML has shipped >1,400 DUV scanners and >180 EUV scanners as of 2025), the service business grows somewhat linearly with it, providing a stabilizing element.
Gross Margin Drivers: ASML’s gross margin is influenced by product mix (EUV vs DUV, new vs refurbished, systems vs service), volume (better absorption of fixed costs at higher volume), and features/upcharges (for example, some customers pay extra for higher productivity variants or for software that improves yield). In 2024, ASML’s gross margin was ~51.3%[9]. It ticked up in the first half of 2025 (53–54% range) due to a favorable mix – more EUV shipments to logic customers – but dipped to 51.6% in Q3 2025[55] with a slight mix change (possibly more lower-margin sales to China or more initial High-NA costs). The company guided ~51–53% margin for the rest of 2025[10], reflecting these puts and takes. Generally, service revenue carries healthy margins (often >50% gross margin) because the cost is mainly labor and replacement parts (which ASML often manufactures or controls pricing on). Upgrades can be especially lucrative (paying, say, €10M for a software or hardware tweak that costs ASML much less to provide). Meanwhile, first-of-a-kind products (like the earliest High-NA tools) might be margin dilutive initially (due to low yield in production and high installation costs). ASML has said long-term margins should rise as High-NA scales and more value-added software content is added to its offerings[29].
Order Interpretation & False Positives: Investors should interpret ASML’s net bookings with caution. A large quarter of bookings can signal booming demand – for instance, Q4 2023 saw €7.1B in bookings[56] (a big jump that included multiple EUV orders). But context matters: that jump partly reflected inflation pass-through and customers pulling orders forward before export rules changed. Conversely, a low bookings quarter can result from timing (customers waiting for new budgets or government approvals). ASML’s orders are also lumpy because one EUV order (~€150M) massively swings the total. There is also a phenomenon of double-ordering in boom times: customers might reserve more slots than needed to ensure supply, then later defer some. ASML insists its backlog is firm, but if demand suddenly dropped, some orders would likely be renegotiated. A common “false positive” in ASML’s model is backlog value increases that aren’t proportional to unit increases – e.g. when ASML raised prices due to inflation, it added >€2B to backlog without new units, inflating bookings[3]. Another is when orders from one region surge (like China in 2023) not purely from end-demand but due to policy deadlines – that can give a one-time bump that later normalizes (indeed China went from 49% of ASML’s orders in one quarter to an expected ~20% of sales next year[23]). Thus, savvy analysis looks at book-to-bill over several quarters and listens to ASML’s commentary on demand drivers by segment.
Valuation and Setup
ASML’s current valuation (≈40× forward earnings) reflects a premium growth narrative. The stock’s re-rating over the past year – it has sharply outperformed peers and the broader market – has been fueled by the story of AI-driven secular demand and ASML’s unique position in capturing that.
For ASML to re-rate even higher (i.e. sustain or expand its P/E despite earnings growth, or see a jump in EV/EBITDA multiples), the market would likely need confirmation that ASML’s growth and profitability will accelerate or extend further than currently expected.
What could cause that? One factor is evidence of multi-year double-digit growth runway: if ASML, for instance, provides a 2026 outlook that significantly beats the street (say guiding +20% sales in 2026, vs current expectations of low-teens), investors may conclude that the anticipated “WFE upcycle” is bigger or longer. A concrete catalyst could be a large wave of orders that forces ASML to raise its longer-term sales scenario – e.g. if High-NA adoption widens beyond Intel, or if AI investments lead TSMC/Samsung to add fab capacity sooner, bumping ASML’s own 2030 targets upward. Another re-rating driver is margin expansion beyond forecasts – if ASML demonstrates it can hit, say, 55–56% gross margin by 2027 (versus ~52% now) due to mix or pricing, then earnings would grow faster than revenue, warranting a higher multiple. Additionally, resilience through a downcycle would bolster the structural thesis: if the industry hits a soft patch but ASML still grows (or only dips slightly) thanks to its backlog and service, the market may reward it with an even more scarcity-like valuation (similar to how some software or industrials are valued for resilience).
On the flip side, a de-rating narrative could take hold if data points start to suggest ASML is more cyclical or facing headwinds. For instance, if peer companies (Applied Materials, Lam Research) guide weak WFE spending and ASML’s orders/backlog begin to fall in tandem, the market might compress ASML’s multiple towards peer levels (mid-20s P/E). Another de-rating trigger would be if ASML’s growth appears to hit a ceiling in the late 2020s: say, hypothetically, chipmakers extend node cycles (buying fewer tools) or geopolitical bifurcation (East/West tech split) caps ASML’s accessible market. If analysts start projecting single-digit growth beyond 2026, ASML could be seen as overvalued.
A specific risk is China exposure: ASML’s China bonanza in 2023–24 (over one-third of revenue[22]) could flip to a drag. Management already warned that China sales will drop significantly in 2026[23] due to export controls. If it turns out that non-China customers can’t fully compensate, ASML might guide a sub-consensus year, which would undercut the “compounder” story and likely compress the multiple. We saw a mini-version of this in Oct 2024, when ASML’s early 2025 forecast (with China normalization) disappointed and the stock fell ~16% in a day[71][72]. That reaction shows how sensitive the stock is to growth expectations. So, for a sustained de-rating, we’d likely need to see either growth shortfall (e.g. 2026 ends up flat or down) or margin erosion (maybe from cost pressures or needing to appease customers on price). Notably, ASML’s backlog acts as a double-edged sword here: it smooths current revenue, but if bookings don’t pick up, backlog burn eventually reveals weak demand – which could suddenly change the narrative in a year or two if new orders remain low.
In summary, what makes ASML re-rate up or down? –
Up: signs of secular growth outpacing prior models (e.g. AI leading to structurally higher capex, or ASML unlocking new TAM like advanced packaging, metrology adjacencies) and proving its quasi-“utility” status in chips (deserving a scarcity premium).
Down: evidence that it’s not immune to downturns (order/bookings contraction, geopolitical loss of a market, or execution slips) which would make investors treat it more like a normal cyclical equipment name.
As of Jan 14, 2026, ASML trades at $1,265/share, near its 52-week high of ~$1,291[1]. The stock’s trailing P/E is ~47× and forward P/E around 40×[25] based on FY2026 consensus EPS (≈$31.3). That is a rich valuation by any standard – significantly above the broader market (S&P 500 ~20×) and above other semi equipment peers. For context, here are some peer multiples and how they differ structurally:
Applied Materials (AMAT): Forward P/E ~26×, EV/EBITDA ~20×. AMAT is the largest broad-line semi equipment maker (deposition, etch, etc.). It’s more diversified across logic, memory, foundry, and has more competition in each segment (TEL, Lam, etc.), which keeps its margins a bit lower (AMAT gross margin ~46–47%, net margin ~25%). AMAT’s business is also more exposed to memory capex swings. Thus, it gets a lower multiple than ASML. Investors see AMAT as high-quality but cyclical; its growth is tied to overall WFE spending. In 2025 AMAT’s revenue is expected roughly flat/down, versus ASML’s +15%, hence the gap in valuation.
Lam Research (LRCX): Forward P/E ~36×[75], EV/EBITDA ~38×[76]. Lam focuses on etch and deposition, with a heavy exposure to memory (especially NAND flash). Lam has excellent margins (ttm gross ~49%, net ~30%[76], similar to ASML) and a strong service business (~30% of sales). Its stock has run up on AI optimism too (it’s +182% YoY[77]), now valued not far behind ASML’s multiple. However, ~30% of Lam’s sales were to China recently, and there is concern that export controls could hit Lam’s business in China (memory fabs in PRC). Indeed, a key question is if Lam’s China revenue will fall below 30% in 2026 and hurt growth[78]. Lam’s higher multiple vs historical norms reflects some scarcity (limited competition in certain process steps) and its own strong execution, but its dependence on memory (which is in a deep downturn in 2024–25) usually makes it more cyclical. The market seems to be granting Lam a partial “AI pass,” expecting a rebound. If one believes memory capex will roar back, Lam’s valuation may be justified, but any delay and it could compress. ASML, by contrast, has more diversified demand (logic/foundry + memory) and is shielded from direct competition, thus warranting a premium over Lam in our view.
KLA Corp (KLAC): Forward P/E ~33×[79], EV/EBITDA ~32×[80]. KLA is a process control/metrology leader – it sells inspection and measurement tools, which are somewhat less capital intensive and more recurring (because as chips get more complex, inspection steps also rise). KLA actually has even higher gross margin (~60.7%[80]) and operating margin (~42.8%[81]) than ASML, reflecting its near-monopoly in many inspection segments and extremely high-value-add (catching defects saves yields). KLA’s multiple is elevated because of this stability and strong cash generation. It’s often viewed as the “ASML of process control.” One difference: KLA’s revenue can be a bit more correlated with fab expansions – if fewer new fabs are built, they sell fewer tools (though they too have a large service base ~30% of sales). Notably, KLA’s beta (1.47)[82] is lower than ASML’s, hinting at slightly less volatility. KLA’s current forward P/E in the low-30s, a premium to AMAT but a hair below ASML, suggests the market sees it as a structural winner too, but perhaps with less growth runway than ASML (analysts expect ~11% 5yr EPS CAGR for KLA vs ~25% for ASML[83][84]). Also, KLA has a large exposure to foundry/logic (where EUV growth is concentrated), so it benefits from similar drivers as ASML.
Tokyo Electron (TEL): (If we include TEL, Japan’s top equipment maker) trades at around mid-20s P/E (TEL tends to have a slightly lower multiple likely due to more memory exposure and being in Japan’s market). TEL competes in deposition, etch, cleaning – again more competition and cyclical.
Analog Devices (ADI): This isn’t a direct comp (ADI is a semiconductor manufacturer, not equipment, but sometimes used as a proxy for broader semi cycle sensitivity). ADI trades ~20× forward earnings and about 7× EV/Sales, reflecting its steadier, diversified chip business (analog chips for industrial, automotive, etc.). ADI’s inclusion is instructive: it is less cyclical than, say, a memory chip company, but still cyclical with the economy. Its lower multiple (compared to ASML) underscores that ASML’s valuation is not just about being in semis, but about being a unique growth engine in them.
SOX or Semi-cap ETF (e.g. SMH): The VanEck Semiconductor ETF (SMH), which includes both chip makers and equipment companies, is up strongly YTD and has an average forward P/E in the mid-20s. The fact ASML is ~40× shows how far above the industry mean it is. The market is essentially saying ASML has a stronger, longer growth trajectory and moat than the average chip stock.
Where do these comps differ structurally?
ASML vs Equipment Peers: ASML has near-monopoly and pricing power, and a large portion of revenue locked in via backlog – peers like AMAT/Lam face more competition and shorter lead times (customers can switch between AMAT, Lam, TEL for some tools; not so for ASML). ASML’s cyclicality is dampened by its ~25% services share and the strategic importance of its tools (customers try hard not to cancel EUV even in downturns). Lam and AMAT also have service businesses (~30% of revenue), but their new equipment orders can swing more wildly with memory/logic investment cycles; they also suffer more pricing pressure when competitors vie for limited spend.
Technicals
On the technical front, ASML’s stock has been in a pronounced uptrend for the past year.
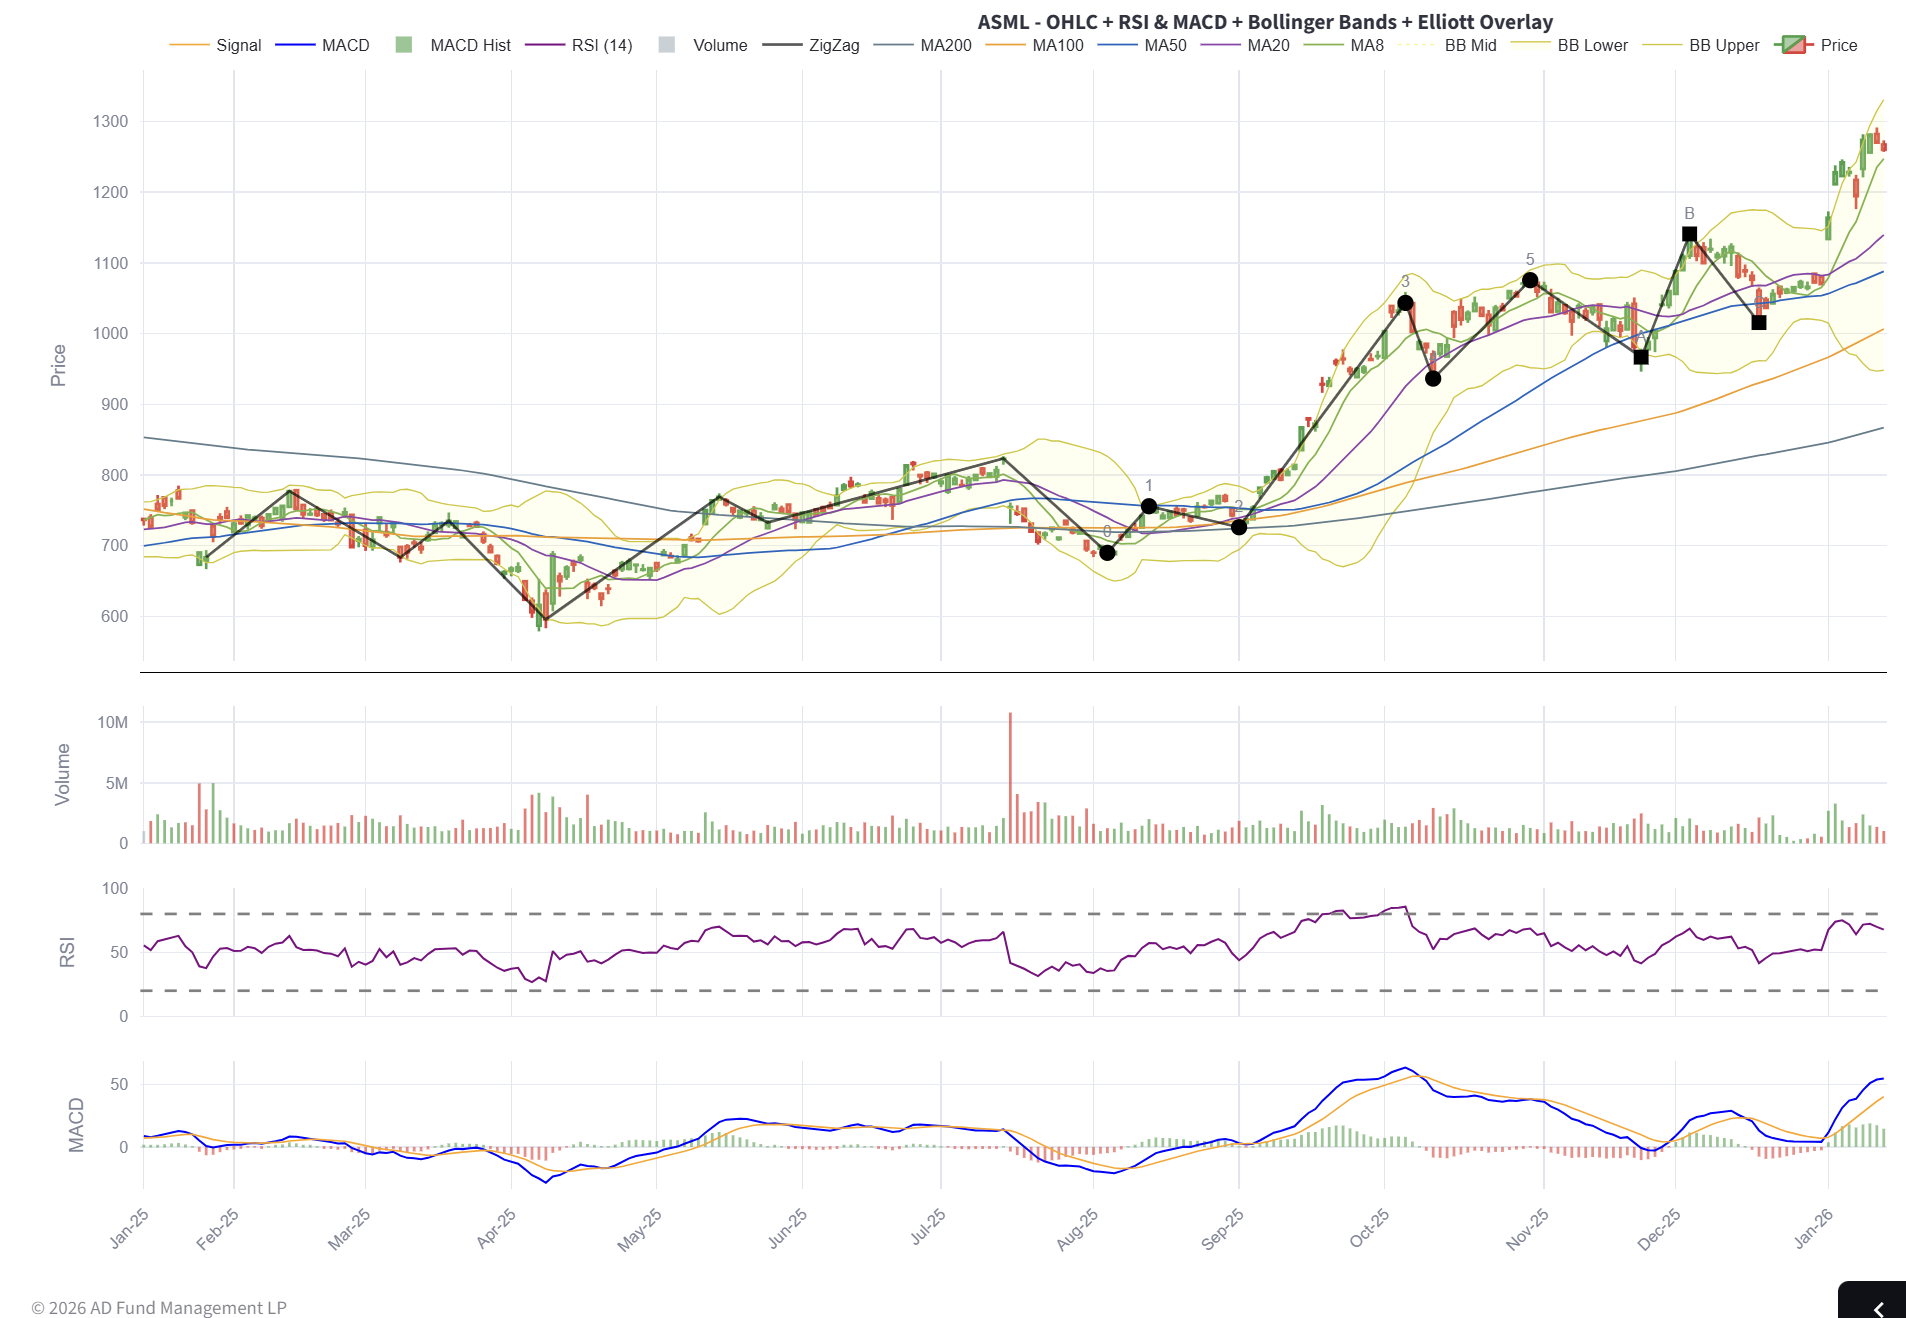
The 21-day moving average (approximately $1,140) and 50-day MA (~$1,085) are both well below the current price, reflecting the stock’s strong recent momentum[1][45]. In fact, ASML is ~10–11% above its 21-day and ~16% above its 50-day MA[45]. The Relative Strength Index (14-day RSI) is ~69[85], just below the classic overbought threshold of 70.
Support Levels: The first notable support is likely the psychological $1,200 level (which the stock has recently been oscillating around). Below that, $1,100 (roughly the 21-day MA region) could offer minor support, as it’s around the breakout level from the last consolidation in December. More significant is the $1,000–$1,050 zone: not only a round number, but near the 50-day MA (~$1,085) and the stock’s prior peak in mid-2025.
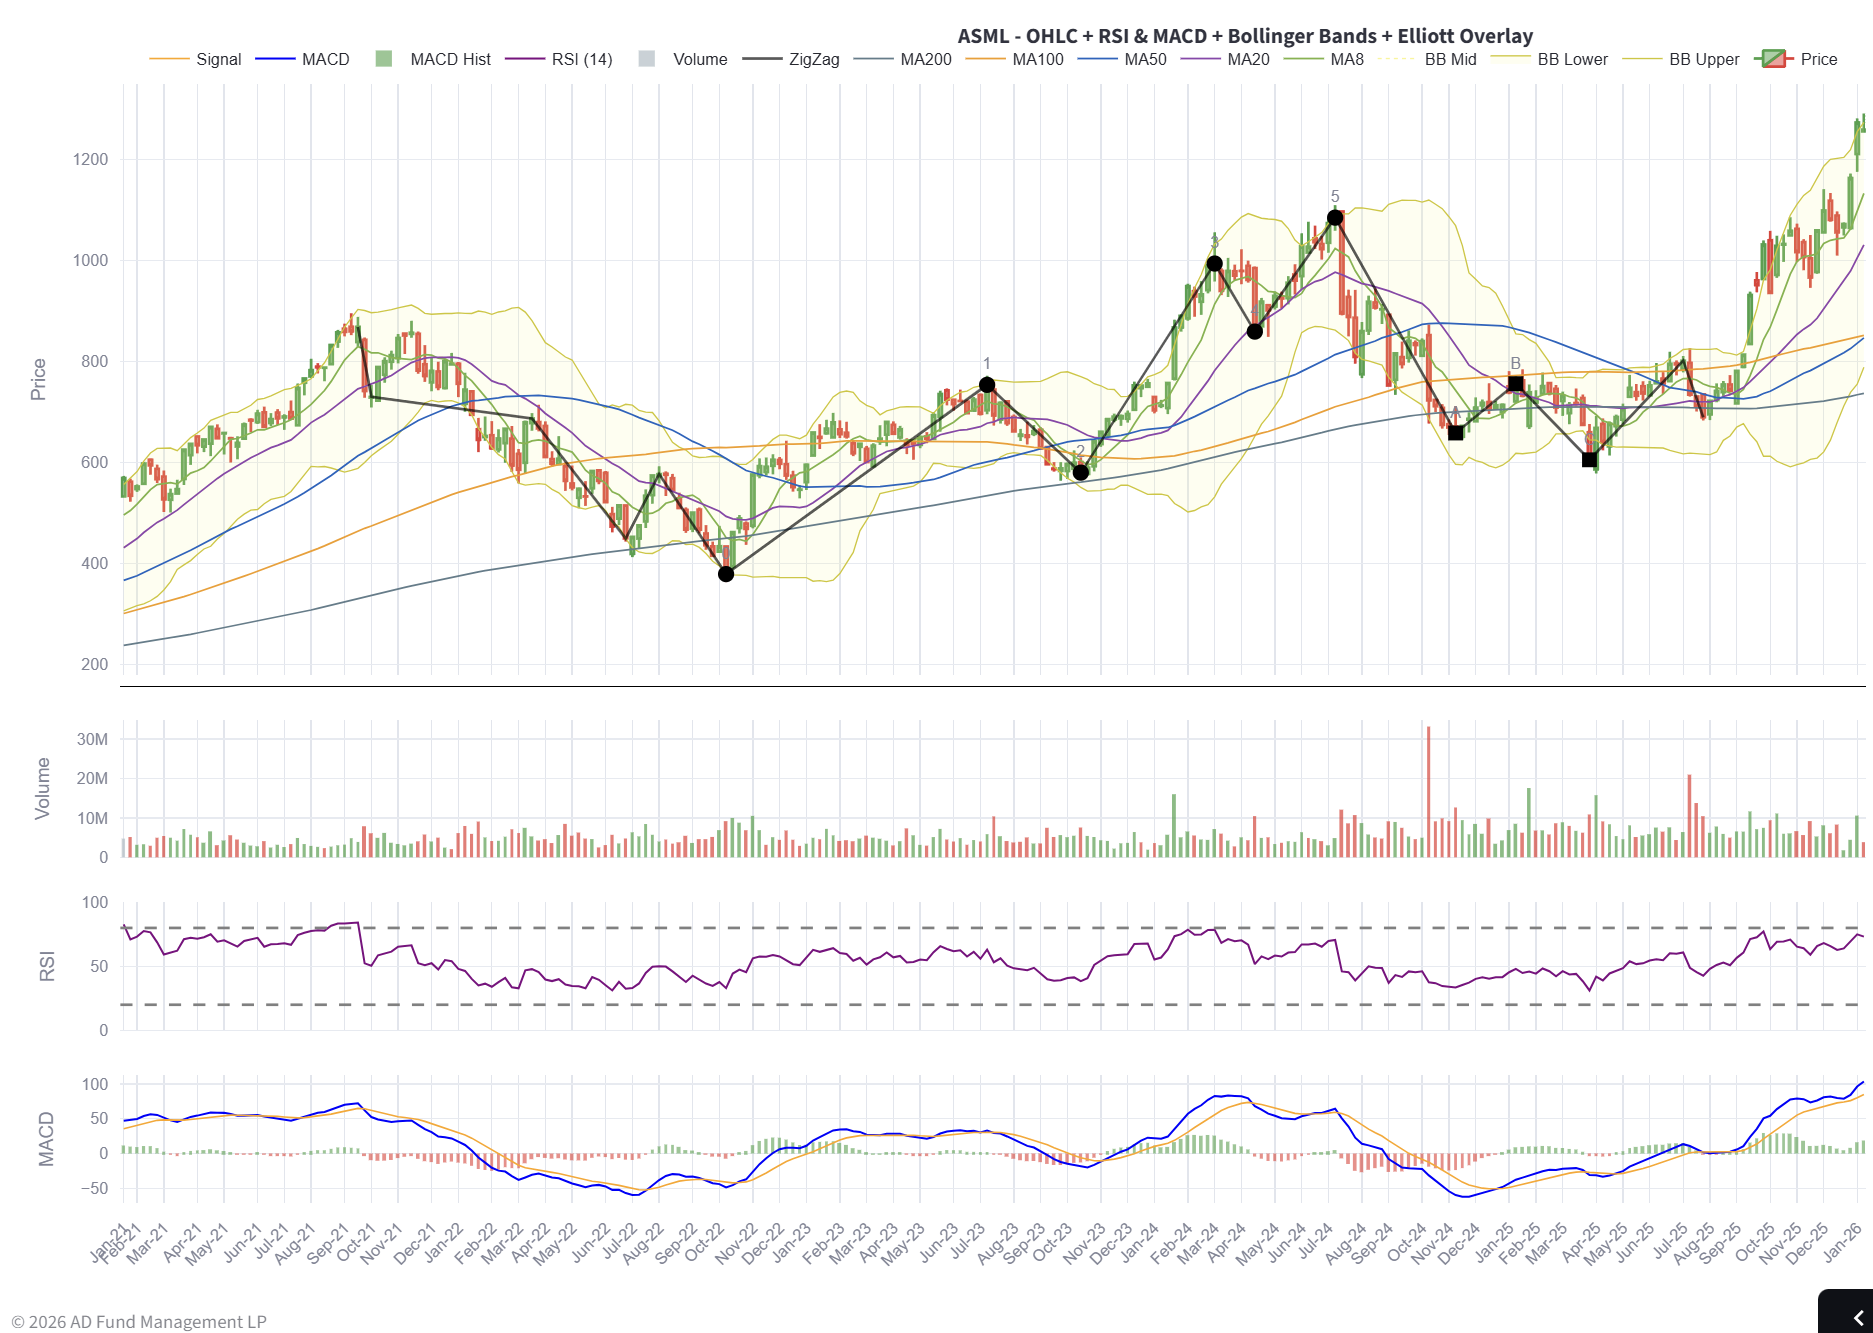
The stock just broke out from its April 2024 highs, when you look at the weekly chart - you’ll notice that the stock isn’t very extended.
Resistance Levels: In price discovery mode, the recent all-time high around $1,291 is the immediate resistance. If ASML pushes above that, round numbers like $1,300 may act as minor resistance simply due to trader psychology. Using Fibonacci or extension techniques (from its last big correction low ~$580 in Oct 2024 to $1,290 high), the next extensions could be around $1,400+ if the rally continues.
In short, technically ASML is in a strong uptrend but overextended in the near term. A healthy pullback to $1,000–$1,100 would not break the uptrend and could even attract new buyers. The bullish technical case holds as long as higher highs and higher lows persist; a drop below the previous major low (~$850) would negate that.


Key Drivers (Next 6–12 Months)
1. Quarterly Earnings and Guidance – The most immediate catalysts are ASML’s Q4 2025 earnings report (scheduled Jan 28, 2026, BMO)[86] and the subsequent Q1 2026 report (mid-April 2026). In these, we expect ASML to provide more detailed 2026 guidance. Key will be any quantification of the “not below 2025” outlook for 2026 – if ASML guides, say, mid-single-digit growth, that might be taken neutrally, but if they surprise with >10% or caution with ~0%, the stock will react. Also listen for gross margin guidance (e.g. if they foresee any margin compression from High-NA costs or lower utilization). Each quarter’s net bookings figure will be scrutinized: a re-acceleration of orders (perhaps from memory customers returning or initial High-NA volume orders) would be a bullish indicator, whereas continued order weakness could pressure the stock. Dates: Jan 28, 2026 (Q4 results); likely mid-April 2026 (Q1), mid-July 2026 (Q2), mid-Oct 2026 (Q3). These will also coincide with peers’ earnings (e.g. TSMC mid-Jan, Intel late-Jan, Lam/AMAT around Jan–Feb) which provide demand color.
2. Investor Day / Buyback Announcements – ASML has hinted at a new share buyback program announcement in January 2026[87]. If they significantly increase the capital return (e.g. a new multi-year buyback >€12B, or a dividend hike above trend), it could support the stock by signaling confidence in future cash flows. Furthermore, ASML typically holds an Investor Day every few years (last was 2022). It wouldn’t be surprising to see an Investor Update in late 2026 where they might update their 2030 targets given how far things have come (in 2022 they guided ~€44B rev in 2030 base-case). Any upward revision of long-term targets at such an event would be a catalyst. Conversely, if they hold off on big new targets or temper them (due to macro or geopolitics), it could dampen sentiment.
3. Major Customer Capex Announcements – Watch for capital spending guidance from the big three customers: TSMC, Samsung, and Intel. TSMC typically gives an annual capex forecast in January and updates mid-year. For 2024, TSMC cut capex; the street will watch if TSMC in Jan 2026 indicates 2026 capex uptick (perhaps for 2nm and advanced packaging) – that would directly feed ASML’s order book. If TSMC signals delay or capital discipline, it could mean slower orders for ASML. Intel, on its earnings calls (late Jan and mid-year), might update on its foundry ambitions and node timing. If Intel stays on track or pulls in its High-NA schedule, ASML benefits (Intel is a big EUV/High-NA customer); if Intel stumbles (delays 18A/20A), that removes a growth driver. Samsung likewise – any commentary on using High-NA for sub-2nm or on memory investment (Samsung spends on EUV for DRAM and V-NAND) will be key. Notably, memory capex is expected to rebound into 2026; confirmation of that (from SK hynix, Samsung, Micron) would be bullish for ASML’s 2H26 orders, whereas any signal of continued cutbacks will be bearish. Specific dates: TSMC earnings ~Jan 15, 2026; Intel ~Jan 27, 2026; Samsung usually late January (though less detail on capex in earnings, more in investor days or press releases).
4. Export Control Developments – Regulatory milestones could impact ASML materially. The Dutch government and EU implementation of export licenses for DUV (effective Sept 2023[88]) is known, but any changes – for example, if the Dutch deny a significant number of license requests, or conversely if they quietly grant some exceptions – will affect ASML’s China business. The U.S. could introduce updated rules; the last major update was Oct 2024, which restricted some older DUV and services to Chinese fabs. We should monitor if the U.S. in 2026 further tightens screws (e.g. extending restrictions to maintenance or to other countries buying ASML tools for Chinese plants). On the flip side, by mid-2026, there might be geopolitical negotiations – e.g. if trade tensions ease somewhat, could ASML be allowed limited EUV exports to, say, fabs in Japan that partner with China? Unlikely near-term, but worth watching official statements. A major risk catalyst is Taiwan-China relations – any escalation there (military drills, etc.) would spook semiconductor stocks including ASML, since TSMC (ASML’s #1 customer) could be at risk. These events are hard to time but important to monitor continuously (news flow, US/China summits, etc.).
5. High-NA EUV Shipments & Milestones – 2026–2027 is when High-NA moves from first customers to broader use. Key milestones to watch: In 2026, ASML is likely to ship a few more EXE:5200 systems – perhaps one to TSMC (if they decide to start integration for 2028 node) and one more to Intel or a memory player. News of a new High-NA order (say Samsung ordering one) would be a positive catalyst, as it indicates widening adoption. By 2027, Intel aims for risk production on 14A; an update from Intel in 2026 about being on schedule or even pulling in that timeline would be a bullish indicator for ASML (more High-NA tools and maybe follow-on orders). Conversely, if Intel’s execution falters or if TSMC publicly states it will postpone High-NA to 2030, that could temper excitement. We’ll also monitor product progress: ASML might unveil the next High-NA model (EXE:5200 “C” or EXE:5300) with improved specs or start talking about post-High-NA improvements – any such R&D success can bolster the long-term story (showing ASML’s innovation pipeline remains full). Typically, ASML presents at the SPIE Advanced Lithography conference each February – in 2026/2027, watch for technical papers on High-NA throughput achieved, resist solutions (if partners like Imec report improved resists enabling better patterning with High-NA). These technical milestones, while geeky, often precede customer ramp confidence.
6. Semiconductor Cycle Indicators – Broader industry metrics will serve as leading indicators for ASML’s business. For example, monthly semiconductor sales (SIA data) and global foundry utilization rates: if we see utilization at TSMC/Samsung above 90% and chip shortages in certain areas, that presages new capacity adds (bullish ASML). If utilization stays sluggish (e.g. if PC or smartphone demand is slow), logic/foundry might delay orders (bearish). SEMI’s equipment billings (a 3-month moving average of global fab tool sales) is another to track – it has been down in 2024 due to memory, but any inflection upward into 2026 would confirm the cycle turning up. By mid-2026, we expect to see if the “AI-driven spending” by hyperscalers (for advanced chips) translates to wafer starts requiring new fabs – announcements of new fab projects or expansions (e.g. TSMC’s Arizona fab progress, Intel’s new fab timelines, European fabs with Chips Act funding) will signal future tool demand. Each such announcement is effectively future backlog for ASML. On the memory side, keep an eye on NAND/DRAM pricing trends and inventory – if pricing recovers by 2026, memory makers will be forced to invest for node transitions (Micron for instance plans EUV introduction in DRAM ~2025–26; confirmation of that timeline at their investor events would be key).
7. Competitive Landscape Developments – While we don’t expect a new EUV competitor, any news on that front would be huge. For instance, if a company (say in China) claimed a breakthrough in 365 nm or e-beam lithography for volume manufacturing, that would be a shock (low probability). More realistically, Nikon’s progress: Nikon aims to have a prototype high-NA ArF immersion by 2027[70]. Any updates on that – e.g. Nikon securing a development partner (if it turned out to be Intel, Samsung or TSMC, which is speculative) – could introduce a competitive angle in DUV which hasn’t existed for ASML in a while. Even minor competition could pressure ASML’s DUV pricing at the margins. We’ll watch Nikon’s quarterly reports or press releases (they sometimes detail lithography business progress). Additionally, adjacent market forays by ASML: the company has been getting into inspection/metrology (with its HMI e-beam tools and YieldStar). If ASML were to make an acquisition (for example, of a metrology firm) or announce a big move in this space, it could open new revenue streams (bullish). The flip side: if ASML struggles to gain share in inspection (where KLA is king), it means that part of the growth story might not materialize. Their computational lithography (software) efforts via the Brion unit is another to track – while small now, any announcement of big orders or new products (maybe AI-driven lithography optimization) could highlight hidden value.
Risks and Reversals
While ASML’s narrative is compelling, several risk factors could break the narrative or force a de-rating. We outline the key risks and what could cause the current positive story to reverse:
1. Geopolitical & Regulatory Risk (China and Beyond): The most immediate risk is the evolving export control regime. As noted, China made up ~36% of ASML’s 2024 revenue[22] (mainly DUV tools) – a proportion that is unsustainable going forward due to new Dutch regulations requiring a license for advanced DUV sales to China effective 2024[69][88]. ASML expects a significant drop in China sales (to ~20% of revenue in 2025)[23]. The risk is this drop could be even sharper or more prolonged. If Chinese fabs cannot get new tools, they also will eventually slow orders for upgrades/spares for existing tools if utilization drops – though servicing older tools is still allowed, a worst-case scenario could see pressure (e.g. the U.S. could push to limit ASML’s support for certain Chinese fabs’ tools). Moreover, China could retaliate (in ways like restricting material supplies or pressuring ASML’s Chinese customer service staff), adding business friction. A specific risk is if a Chinese advanced fab (like SMIC) cancels or defers a big ASML order because they realize they won’t get the export license – that would hit bookings.
2. Customer Roadmap Risk (Delay or Failure): ASML’s growth depends on customers hitting their technology milestones. If a major customer stumbles, it can ripple to ASML. For instance, Intel’s risk: Intel has been buying leading-edge tools (EUV, High-NA) to regain process leadership by 2026–2027. Should Intel encounter technical issues (as it did in 10nm era) and delay its 18A or 14A nodes, it might push out acceptance of some ASML tools or reduce future orders. Similarly, if TSMC’s 3nm or 2nm ramp is slower due to yield or demand issues (say Apple’s uptake is lower, etc.), TSMC could adjust tool deliveries. Memory risk: DRAM makers plan EUV for next nodes; if, hypothetically, a DRAM maker finds an alternative (like double patterning ArFi or EUV multi-pattern proving too costly and they delay adoption), that reduces ASML’s TAM. For example, if SK hynix or Samsung decide to minimize EUV layers to save cost in a downturn, they might not purchase the next EUV tool as soon. Customer concentration is also a subtle risk: TSMC, Samsung, and Intel are a huge portion of ASML’s EUV business. If any one of them decided to cut capex drastically (like in a recession scenario), ASML would feel it. The risk of over-reliance on a few big spenders means ASML is not completely diversified.
3. High-NA Throughput/Yield Risk: High-NA EUV is new and extremely complex. There is a risk that it doesn’t deliver the promised improvements in real fab conditions. If, for example, the first High-NA tools have uptime issues or if suitable photoresists cannot be found to pattern reliably at 0.55 NA (a known challenge: stochastic defects, etch bias, etc.), chipmakers might delay High-NA volume adoption. This would hurt ASML because High-NA is a big part of growth from 2026 onward (with each tool being so expensive). We have early positive signs (Intel’s tool installed, SK hynix taking delivery early[65]), but the real test is 2026–2027 pilot production. If Intel cannot achieve expected performance on 14A using High-NA and must slip to 2028+, ASML might not get follow-on orders as planned. Another risk: cost and complexity for customers – these High-NA systems are huge and power-hungry (rumored >1 MW power draw each). Fabs need to make significant facility upgrades to host them. If a customer’s fab isn’t ready (e.g. power or cleanroom constraints), that could delay installation and revenue recognition. ASML’s credibility would take a hit if, say, they ship tools that sit idle or need modifications.
4. Supply Chain and Production Capacity Constraints: ASML depends on a network of specialized suppliers (e.g. Carl Zeiss for lenses and mirrors, Cymer for light sources (which ASML owns), Trumpf for lasers, etc.). During the 2021–2022 boom, ASML had challenges meeting demand due to certain parts shortages. If another wave of shortages occurs (say a critical component lead time blows out), ASML’s deliveries could be hampered. While they are working closely with suppliers (investing, etc.), the complexity leaves little slack. For example, Zeiss’s ability to produce enough High-NA lens systems is a gating item – if Zeiss can only make, say, 4 high-NA optical systems a year initially, that caps ASML’s shipments regardless of demand. Also, any quality issues at a supplier (e.g. contamination in optical blanks) could cause delays. On ASML’s own side, ramping production from ~60 EUVs/year to 90 is non-trivial – any execution slip (labor shortages, factory bottlenecks) could mean ASML can’t meet its output targets, thus elongating lead times and potentially frustrating customers (or missing near-term revenue opportunities). Furthermore, pre-building inventory as they’re doing in 2024 means taking on risk – if the expected orders don’t all materialize, ASML could be stuck with some work-in-progress inventory or have to slow production, which would hurt operating leverage.
5. Cyclical Downturn / WFE Budget Cuts: The semiconductor capital spending cycle is notoriously boom-bust. A major risk is that 2026–2027 see a larger WFE downturn than anticipated. Right now consensus thinks 2024 was bottom-ish and 2026–27 will improve, but if macroeconomic conditions worsen (e.g. global recession reduces electronics demand sharply), chipmakers might slam the brakes on capex. That would inevitably hit ASML’s bookings and eventually revenue. ASML’s backlog might delay the hit by a couple of quarters but not indefinitely. A sign would be if we see multiple customers cutting orders or asking ASML to delay shipments. In such a scenario, ASML’s revenues could actually decline (which hasn’t happened since 2019). The stock would almost certainly de-rate in that case.
Conclusion
This is the end of the deep dive for ASML 0.00%↑ and the theme in general - in the fund we own KLAC 0.00%↑ AMAT 0.00%↑ and ASML 0.00%↑. I am happy with the performance in the first two weeks of January. If INTC 0.00%↑wakes up, and Samsung keeps at it, ASML will have two great buyers in addition to TSM 0.00%↑. ASML sits in a class of its own as the linchpin of advanced chipmaking – its near-monopoly on critical lithography technology makes it a structural winner in an industry fueled by insatiable demand for computing power.
The company’s robust backlog, rising service annuity, and EUV leadership position it to keep benefiting from every extra layer and every new fab that the AI era requires. At ~40× forward earnings the stock isn’t cheap, but for good reason: ASML’s scarcity value and growth prospects warrant a premium. I like the theme, and within the theme I like ASML 0.00%↑, a lot.